Basic Ethereum Node Monitor
The Basic Ethereum Node Monitor plugin is responsible for monitoring the health and status of your Ethereum node. That data is then pushed to the InfluxDB database, which can be visualized in Grafana.
Installation
To install the Basic Ethereum Node Monitor plugin, navigate to the "Web3 Pi Updater" section in the Cockpit interface. Search for "Basic Ethereum Node Monitor" and install the plugin. On newer Web3 Pi releases, this plugin might be pre-installed by default.
Usage
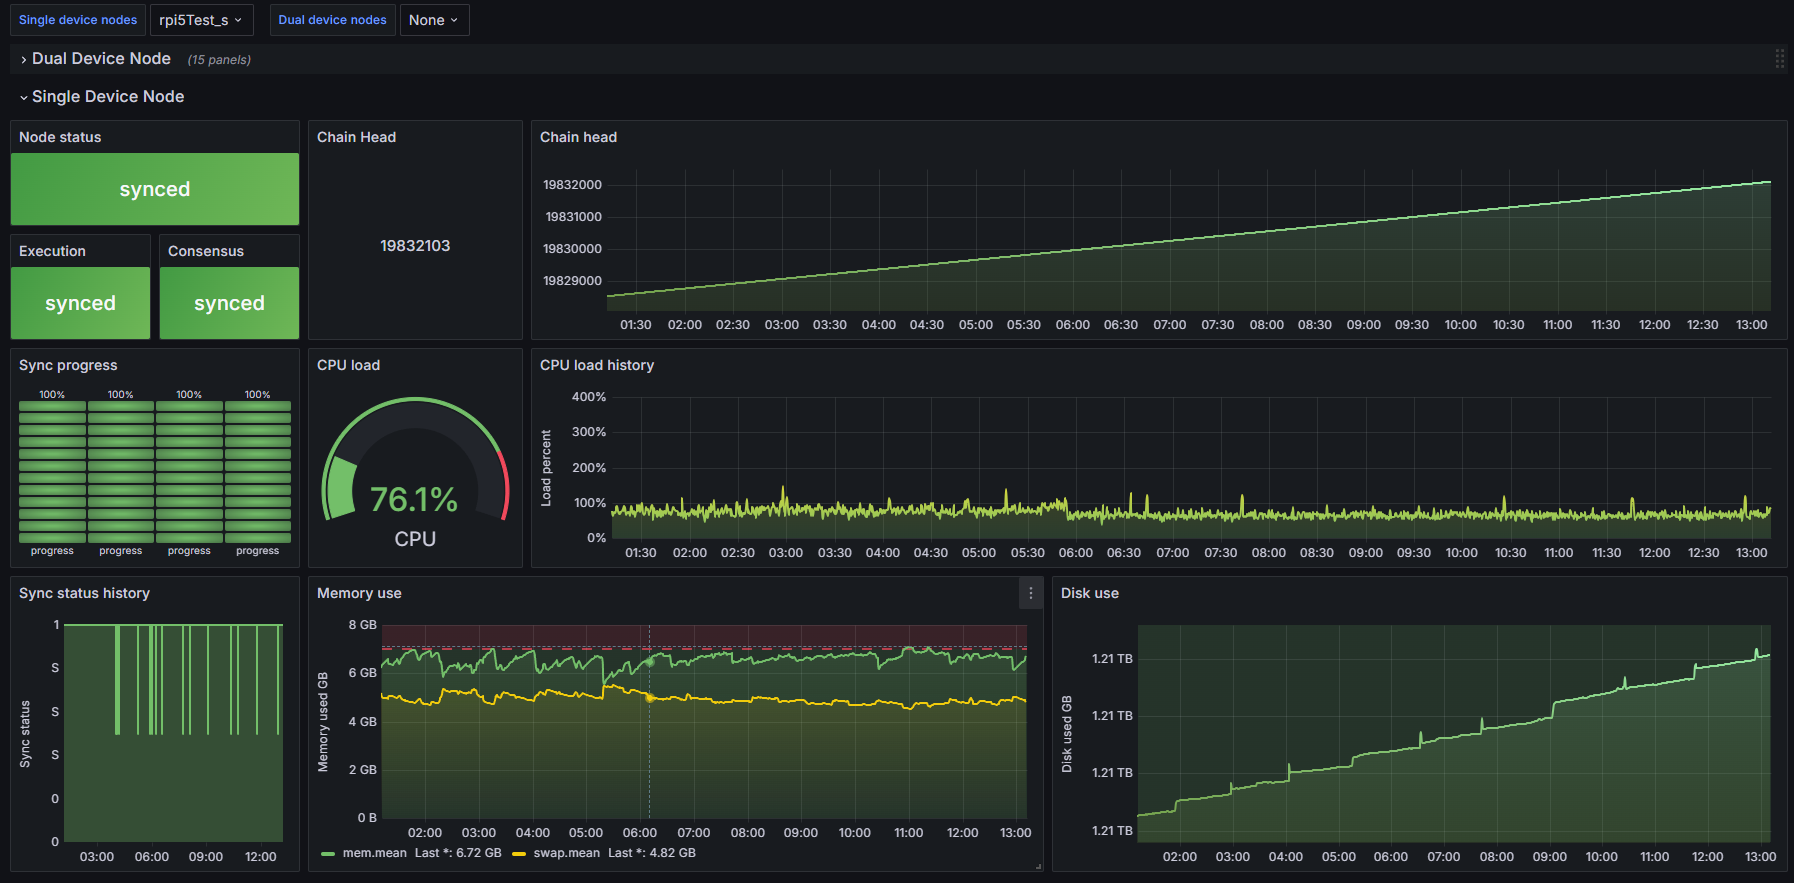
Once installed, the Basic Ethereum Node Monitor plugin will start automatically. Open Grafana in your web browser (port 3000 by default) to view the collected data.
Support
For support and further assistance, join the Web3 Pi Discord community.